

Announcements
Announcements
The newest version of SEI’s Long-range Energy Alternatives Planning system includes a scenario explorer, enhanced graphics, a simpler interface, and multiple performance improvements.
LEAP is a powerful, versatile software tool for integrated energy planning and climate change mitigation assessment developed by SEI’s U.S. Center, and distributed at no charge to academic, nonprofit and government organizations in the developing world and to students worldwide. In the last year alone, more than 2,000 people actively used the tool, and the LEAP online community has now grown to over 22,000 members in 191 countries.
LEAP can be used at a wide range of scales, from cities and states to national, regional and even global applications. It is fast becoming the de facto standard for countries undertaking integrated resource planning and GHG mitigation assessments, especially in the developing world, and for creating Low Emission Development Strategies (LEDS).
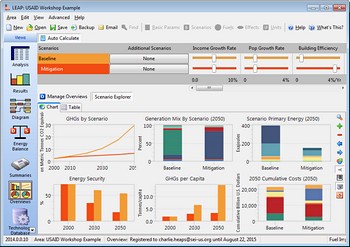
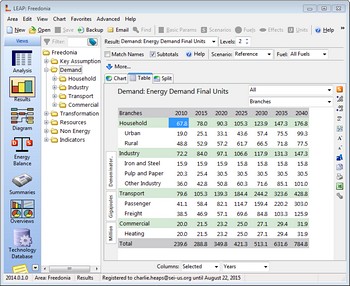
The newest version, LEAP 2014, released on 6 June, offers much-faster calculations (2-10x), a simpler interface, and several added features. Most notably, it makes it easier to share and discuss modelling results with non-technical audiences, with improved charts and results tables, and a new Scenario Explorer.
With the Scenario Explorer, users can explore the implications of different policy choices, using slider bars that are connected to key parameters in the underlying LEAP data set. As they pull on these sliders, results are immediately recalculated and shown in overview charts. The tool can also be used to quickly “switch on” or “switch off” specific measures within an overall scenario.
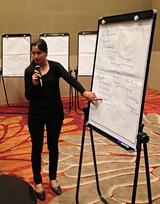
For example, a LEDS might consist of separate Nationally Appropriate Mitigation Actions (NAMAs) in areas such as energy efficiency, fuel switching, renewables or reducing process emissions. Each of these NAMAs can be modelled separately in LEAP. With the new Scenario Explorer, users can try out different combinations of the measures to decide which overall strategy is preferable. Combined with a new Full Screen View (accessed by pressing F11), these new features make LEAP even more useful for stakeholder workshops.
“The ultimate purpose of LEAP is to inform policy and practice. While, modeling is necessarily a highly technical endeavor, our goal with this new release of LEAP is to create a tool that helps modelers to better interact with decision-makers and helps laypeople better understand and interact with models”, says Dr. Charles Heaps, developer of LEAP.
The changes in LEAP 2014 reflect SEI’s experiences building capacity with LEAP as well as feedback from users around the world.
“LEAP’s simple and intuitive interface allows us to engage stakeholders and policy-makers in the process of building the energy model, making it more accurate and useful,” says Prof. Wilbert Rey D. Tarnate, of the University of the Philippines Diliman, who recently used LEAP to develop scenarios in a project funded by the U.S. Agency for International Development (USAID).
“LEAP is both basic and advanced,” Tarnate adds: “basic since even beginners would find it easy to use and understand, and advanced since its flexibility allows energy modelers to select from a variety of data structures for developing models and scenarios. And LEAP’s emphasis on scenario and alternatives analysis helps keep the model relevant to policy-makers.”
LEAP 2014 also includes several other upgrades and new features:
• Improved optimization: LEAP can now work seamlessly with IBM’s “industrial strength” CPLEX solver for increased speed and the ability to handle larger data sets.
• Improved costing: The Transformation module cost balance report can now include the stranded costs (i.e. debt payments) on pre-existing capacity, with a new LoanPayment function to calculate remaining annualized costs. It also allows feedstock and auxiliary fuel costs to be specified in a more flexible way.
• Tags: These can be helpful for classifying technologies that belong to more than one category; for example, power plants could be tagged as thermal, renewable or nuclear technologies, or as pre-existing or new types of power plants, or by area.
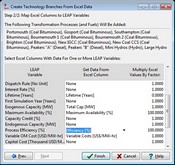
• New ‘Create Branches from Excel’ wizard: Much of the data required for energy and climate planning is available in tabular form in spreadsheets. The new wizard allows users to map the types of data in the spreadsheets to the variables expected by LEAP, and where possible, also converts the data into the measurement units expected in LEAP.
• Simplified and more robust user interface: Operation of LEAP is now simpler and more consistent across different views, with new one-click options and several interface refinements, especially to auto-complete features that help users write their model expressions.
• Thoroughly updated help: The help files reflect all the changes in LEAP 2014, with improved formatting and additional pages devoted to describing important concepts such as capacity expansion planning in Transformation and the new tags feature.
“This is a crucial time for climate change mitigation analysis,” says Dr. Heaps. “I hope that LEAP 2014 will prove to be a valuable tool as countries prepare their intended Nationally Determined Contributions for a post-2015 climate agreement. I am confident that this is the most powerful and robust version of LEAP to date.”
Learn more and download LEAP 2014 »
Journal article / This article focuses on the state practice of Caribbean SIDS regarding the consent regime for marine scientific research under UNCLOS.
Journal article / Researchers developed an enhanced methodology to estimate future health burdens from air pollution. The new estimates improved strikingly upon previous metrics.
Feature / Discover how SEI's Consumption Compass aids Swedish municipalities in slashing climate impact through smarter consumption.
Design and development by Soapbox.